
Alignment of Simulated Short WGS M. Tuberculosis Reads
by Michael Martin
TL;DR
- Alignment with Bowtie 2 resulted in reporting more false positive SNPs and indels than BWA and SMALT from simulated MTB reads.
One of the projects I’m working on in the Hanage lab is looking at deep sequencing data from Mycobacterium tuberculosis (MTB) outbreaks in British Columbia to see if shared rare variants can be reliably identified and used to determine transmission between cases, identify instances of un-sampled patients, and eventually to estimate transmission bottleneck size. The presence of heterozygous bacterial populations has been shown to be present in >20% of MTB cases in some settings and to impact treatment response.
In our initial exploration of sample data provided by our collaborators at the British Columbia CDC, we noticed discrepancies in the number of variant sites identified, depending on the tool used to align paired-end illumina reads to the reference H37Rv genome. For a particular sample, using identical downstream variant calling pipelines, VarScan (java -jar VarScan.v2.4.3 mpileup2cns -variants 1 --min-var-freq 0.0 --min-coverage 30 --min-avg-qual 10 --min-reads2 2 --strand-filter 1 --p-value 0.01) identified 1,803, 1,983, and 2,503 variant positions at a read frequency of >5% while using Bowtie 2 v2.3.2 in end-to-end mode (bowtie2 -x NC_000962.3 -1 read1.fastq -2 read2.fastq -S bowtie.sam), BWA-MEM v0.7.15-r1140 (bwa mem NC_000962.3.fasta read1.fastq read2.fastq > bwa.sam), and SMALT v0.7.6 (smalt map -y 0 -x -i 1000 -j 50 -f samsoft -o smalt.sam NC_000962.3 read1.fastq read2.fastq), respectively, to align the reads to the reference genome, respectively.
Furthermore, we noted that nearly 1,000 variant positions which were identified from the SAM files aligned with SMALT were not identified when alignment was done with Bowtie and that about 70% of these missing variants were located in Proline-Glutamate/Proline-Proline-Glutamate (PE/PPE) gene regions. These regions make up 6.4% of the genome, are known to be GC-rich and highly repetitive in nature, and are often excluded from WGS-based analysis due to the inherent difficulty in aligning reads to repetitive regions, which has been shown to result in false positive SNP calls. There are also a number of repeated mobile elements within the MTB genome, including IS6110, which is used for both diagnostic and phylogenetic purposes. We therefore decided to conduct a more systematic comparison of Bowtie2, BWA, and SMALT in the alignment of genes to the H37Rv reference using WGS reads simulated with DWGSIM.
Illumina reads were generated using DWGSIM from the H37Rv sequence to a depth of 180 (approximate average read depth of our experimental data), read lengths of 125BP, with a mutation rate of 0.00025 (indel fraction 0.0). This simulated 1,075 SNPs, the same genetic distance between H37Rv and the hypervirulent CDC1551 clinical strain. Of the 1,075 generated SNPs, 60 were in PE/PPE gene regions and 23 were in mobile elements. Reads were aligned using SMALT, Bowtie, and BWA. SAM files were sorted (samtools sort -O bam *.sam -o *.bam) and converted to mpileup with samtools v1.3.1 (samtools mpileup -f NC_000962.3.fasta -B -q 20 *.bam) and variants were called with VarScan. The VarScan output was cross-referenced against the list of simulated variants and a list of PE/PPE and mobile elements in H37Rv using a custom Python v2.7.10 script.
| Total | SNPs >5% | Indels >5% | Correct | Total (False -) | PE/PPE (Fale -) | IS (False -) | Total (False +) | PE/PPE (False +) | IS (False +) | |
|---|---|---|---|---|---|---|---|---|---|---|
| Bowtie | 1924 | 1486 | 7 | 1059 | 16 | 2 | 9 | 427 | 157 | 0 |
| BWA | 4237 | 1086 | 0 | 1063 | 12 | 0 | 9 | 23 | 0 | 3 |
| SMALT | 3463 | 1080 | 0 | 1063 | 12 | 0 | 9 | 17 | 1 | 2 |
BWA and SMALT performed very similarly, both correctly aligning the same set of 1,063 SNPs. Of the 12 false negative SNPs, a disproportionate amount were within mobile elements and only one was located in a PE/PPE gene region. Reads aligned with BWA had slightly more false positive SNPs, with all of these present in mobile elements. Comparatively, Bowtie performed poorly. While the least number of total sites with heterozygous reads were identified using Bowtie as an alignment tool, most of these were present at read frequencies larger than 5% and 427 erroneous SNPs were present in the alignment, with 157 of these in PE/PPE gene regions. Increasing the read frequency cutoff to 10% only reduced the number of false positive to 249. Additionally, the Bowtie alignment introduced six insertions of one through six base pairs in length, and one deletetion of two base pairs. None of the indels were in PE/PPE regions or mobile gene elements. The same nine false negative SNPs from the BWA and SMALT alignments were also missing from the Bowtie alignment. Of those, five were present in regions annotated as IS6110 and four were in regions annotated as IS1081.
To evaluate the performance of the algorithms in the presence of sites with heterozygous reads (minor variants), reads with a mutation rate of 0.00025 were generated to a read depth of 120 and reads with no mutation rate were generated to a read depth of 60. Reads were concatenated to simulated a total read depth of 180. DWGSIM simulated 1,109 variant positions. Of those 1,109 variants 66 were in PE/PPE gene regions and 17 were in mobile elements. SNPs were called using the same workflow as described above.
| Total | SNPs >5% | Indels >5% | SD | Correct | Total (False -) | PE/PPE (False -) | IS (False -) | Total (False +) | PE/PPE (False +) | IS (False +) | |
|---|---|---|---|---|---|---|---|---|---|---|---|
| Bowtie | 1556 | 1545 | 10 | 0.0533 | 1105 | 4 | 1 | 2 | 440 | 142 | 1 |
| BWA | 4033 | 1152 | 0 | 0.0356 | 1107 | 2 | 0 | 1 | 47 | 4 | 1 |
| SMALT | 3310 | 1135 | 0 | 0.0363 | 1103 | 6 | 0 | 5 | 32 | 4 | 0 |
The results of this exercise were congruent with the previous results. Alignment with Bowtie once again led to the identification of the least total number of variants, but identified an order of magnitude more false positive variants at >5% read frequency, with almost all of these being in PE/PPE gene regions. Aligning reads with Bowtie resulted in the identification of six insertions and four deletions. One of the insertions and one of the deletions were the same as indels identified in the above SNP analysis. The alignments done with BWA and SMALT were comparable, with BWA resulting in less false negative variants, but more false positive variants as compared to SMALT. The majority of false negative variants for all three alignment tools were in IS gene sequences while the majority of false positive variants was in PE/PPE regions.
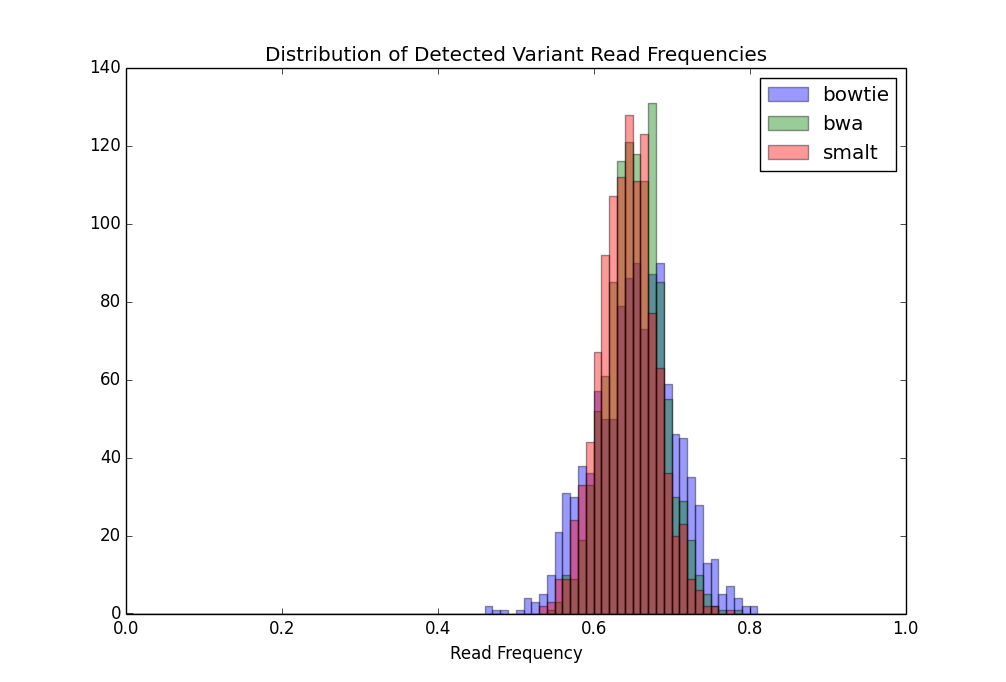
Given that all variants were simulated to occur in exactly 67% of the reads (or nearly 67% after accounting for simulated sequencing error), we wished to see if this was reflected in the identified variant read frequencies. A normal distribution was fit to a list of the correctly identified variant frequencies. The curves fit to variants detected from the BWA and SMALT alignments had similar standard deviations, 0.0356 and 0.0363, respectively, whereas the curves fit to variants detected from the Bowtie alignment had a standard deviation of 0.0533. The larger spread of detected read frequencies indicates that even though a comparable number of the simulated variants were detected from the Bowtie alignment, more individual reads were misaligned as compared to the other alignment algorithms.
Initially, these results appear to be at odds with what was observed in our experimental data, in which aligning with Bowtie resulted in the identification of less variant bases as compared to BWA or SMALT. However, with simulated reads, Bowtie also detected the least total number of positions with at least one heterozygous read (including SNPs and simulated sequencing errors), however more of these variants were present at frequencies larger than the 5% threshold as compared to the other alignment tools. It is possible that due to greater heterogeneity in the experimental reads (either representative of actual sample heterogeneity or increased sequencing error), there are more variant positions, which Bowtie minimizes via erroneous alignment or the introduction of indels. Unfortunately, to our knowledge, there are no programs which can simulate reads representative of heterogeneity within a population, making it difficult to test this assumption and evaluate the performance of these tools for our specific use case. Ultimately, the PE/PPE regions which were the initial motivation for this exercise appeared to present less of a problem than expected, except for the Bowtie alignment. Mobile elements also did not appear to present significant difficulties for any of the alignment algorithms.
It is worth noting that we ignored both small indels and large structural variation in this analysis. The mobile elements, in particular, can vary both in number and location between samples. This variation poses an obvious difficulty to mapping tools which is not represented in our analysis. Especially in light of our future analysis, where we will be comparing minor variants between samples, mapping errors around insertion sequences may lead to both false positive and false negative variant calls and add noise to the data which is not represented by this analysis.